Instrument Description
NOTE: The definitive source for specifications, performance, and limits of the ERIS instrument is the user manual!
AO Performance and Limits
The instrument can be operated in four different AO modes:
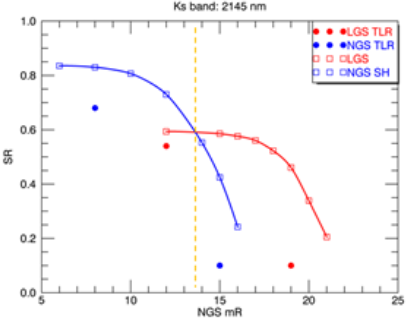
- Natural Guide Star (NGS) mode: using either the target star or a slightly off-axis (<30" recommended) guide star.
- Laser Guide Star (LGS) mode: using one of the four lasers of the 4LGSF, and a tip-tilt star for truth sensing.
- Seeing Enhancer (SE) mode: LGS without a tip-tilt star. Only higher-order modes are corrected, uses VLT stabilization.
- No AO (noAO) mode: seeing-limited mode, VLT stabilization only.
Note that the minimum allowed distance between the NGS/TT star and the moon is 25 degrees.
| Gaia BP | Gaia RP | Off-axis? | K-band Strehl |
Airmass Limit |
TCAT (DIMM) Limit |
FLI Limit |
|
|---|---|---|---|---|---|---|---|
| NGS | <=19 | NGS: <11 | 0" - 60" (<30" recommended) |
< 0.85 | <1.9 | <=70% (<=1.15") | N/A |
| LGS | <=19 | TT star: 7 - 18 | 0" - 60" | < 0.6 | <1.9 | <=85% (<=1.4") | <=0.5 for TT mag > 16 |
| LGS-SE | N/A | N/A | N/A | TBC | <1.9 | <=30% (<=0.8") | N/A |
| noAO | N/A | N/A | N/A | N/A | <2.9 | Any | N/A |
IFS Performance and Limits
Observations with the IFS can be taken in any one of twelve grating configurations and three plate scale configurations. Note that the spaxels are rectangular, and the name of the plate scale configuration corresponds to the long axis, twice the length of the short.
Grating configurations
| Band | λc (um) | λ range (um) | Resolution |
|---|---|---|---|
| J_low | 1.25 | 1.09--1.42 | ~5000 |
| H_low | 1.66 | 1.45--1.87 | ~5200 |
| K_low | 2.21 | 1.93--2.48 | ~5600 |
| J_short | 1.18 | 1.10--1.27 | ~10000 |
| J_middle | 1.26 | 1.18--1.35 | ~10000 |
| J_long | 1.34 | 1.26--1.43 | ~10000 |
| H_short | 1.56 | 1.46--1.67 | ~10400 |
| H_middle | 1.67 | 1.56--1.77 | ~10400 |
| H_long | 1.76 | 1.66--1.87 | ~10400 |
| K_short | 2.07 | 1.93--2.22 | ~11200 |
| K_middle | 2.20 | 2.06--2.34 | ~11200 |
| K_long | 2.33 | 2.19--2.47 | ~11200 |
Plate scale options
| Tag | Spaxel size | Field of view |
|---|---|---|
| 25mas | 12.5 x 25 mas | 0.8" x 0.8" |
| 100mas | 50 x 100 mas | 3.2" x 3.2" |
| 250mas | 125 x 250 mas | 8.0" x 8.0" |
Brightness limits
To avoid the effects of persistence there is a limit to the brightest star that can be observed with the IFS. These limits are described in the User Manual, and the Phase 2 pages.
NIX Performance and Limits
NIX offers a variety of observing modes that can be used in conjunction with the AO modes described above:
- Short-wavelength imaging: Imaging with the 13 or 27mas camera (FoV of approx 27"x27" and 55"x55") with any filter in the J, H, and K bands.
- Long-wavelength imaging: Imaging with the 13mas camera (FoV of approx 27"x27") with any filter in the L and M bands.
- Apodizing phase plate (APP) coronagraphy: Pupil-plane coronagraphy with K, L-band narrowband filters.
- Focal plane coronagraphy (FPC): Focal-plane coronagraphy with a vortex coronagraph and the L and M-band broadband filters.
- Sparse aperture mask (SAM) imaging: Sparse aperture masking with one of three aperture masks and any narrowband filter.
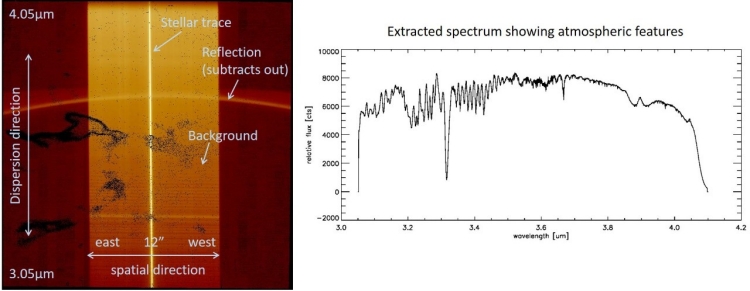
- Long-slit spectroscopy (LSS): Medium-resolution (R~900) L-band slit spectroscopy.
Valid instrument configurations and filters for NIX
This table summarises the filters available in NIX.
| Filter | λc (um) | FWHM (um) | Average transmission (%) |
Peak transmission (%) |
|---|---|---|---|---|
| J | 1.28 | 0.20 | 82 | |
| H | 1.66 | 0.31 | 93 | |
| Ks | 2.18 | 0.39 | 87 | |
| Short-Lp | 3.32 | 0.43 | 80 | |
| L-Broad | 3.57 | 1.04 | 83 | |
| Lp | 3.79 | 0.60 | 78 | |
| Mp | 4.78 | 0.58 | 80 | |
| Pa-b | 1.282 | 0.021 | 75 | 83 |
| Fe-II | 1.644 | 0.020 | 86 | 94 |
| H2-cont | 2.068 | 0.064 | 80 | 90 |
| H2-1-0S | 2.120 | 0.020 | 67 | 77 |
| Br-g | 2.172 | 0.020 | 65 | 75 |
| K-peak | 2.198 | 0.099 | 83 | 89 |
| IB-2.42 | 2.420 | 0.049 | 71 | 82 |
| IB-2.48 | 2.479 | 0.051 | 65 | 78 |
| Br-a-cont | 3.965 | 0.108 | 82 | 91 |
| Br-a | 4.051 | 0.023 | 69 | 80 |
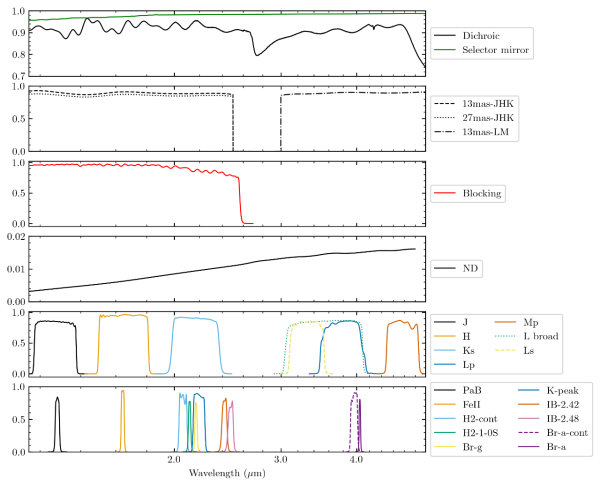
A plot of the filter transmission curves is available here, and the data used to create this plot are available in this archive. The total throughput of the instrument as a function of wavelength can be obtained as an output of the ERIS ETC ("Select Plots" > check the various througput efficiencies).
This table summarises the valid combination of the aperture, camera, filter and pupil wheel, as well as the valid tracking modes. A description of the various pupils can be found in the User Manual.
| Aperture | Camera | Filter | Pupil | Tracking | |
|---|---|---|---|---|---|
| Short imaging | Small | 13mas-JHK | Any < 2.5um | JHK-pupil, Blocking*, ND | Field, Pupil |
| Large | 27mas-JHK | Any < 2.5um | JHK-pupil, Blocking*, ND | Field, Pupil | |
| Long imaging | Small | 13mas-LM | Any > 2.5um | LM-pupil, ND | Field |
| LM-pupil, ND, Spider | Pupil | ||||
| APP | Small | 13mas-JHK | H2-cont, H2-1-0S, Br-g, K-peak IB-2.42, IB-2.48 |
APP | Pupil |
| Small | 13mas-LM | Br-a, Br-a-cont | APP | Pupil | |
| FPC | AGPM-L | 13mas-LM | Short-Lp, Lp, Br-a, Br-a-cont | Lyot, Lyot-ND | Pupil |
| AGPM-M | 13mas-LM | Mp | Lyot, Lyot-ND | Pupil | |
| SAM | Small | 13mas-JHK | < 2.5um (narrow only for SAM-23) | SAM-7/9/23 | Pupil |
| Small | 13mas-LM | > 2.5um (narrow only for SAM-23) | SAM-7/9/23 | Pupil | |
| LSS | Slit mask | 13mas-LM | L-Broad | Grism | Field |
* Not currently offered
This table further details the valid pupil wheel and filter wheel combinations.
| Pupil/Filter | J | H | Ks | Short-Lp | Lp | L-Broad | Mp | Pa-b | Fe-II | H2-cont | H2-1-0S | Br-g | K-peak | IB-2.42 | IB-2.48 | Br-a-cont | Br-a |
|---|---|---|---|---|---|---|---|---|---|---|---|---|---|---|---|---|---|
| JHK-pupil | ✔ | ✔ | ✔ | ✔ | ✔ | ✔ | ✔ | ✔ | ✔ | ✔ | ✔ | ||||||
| Blocking* | ✔ | ✔ | ✔ | ✔ | ✔ | ✔ | ✔ | ✔ | ✔ | ✔ | ✔ | ||||||
| LM-pupil | ✔ | ✔ | ✔ | ✔ | ✔ | ||||||||||||
| Spider | ✔ | ✔ | ✔ | ✔ | ✔ | ||||||||||||
| ND | ✔ | ✔ | ✔ | ✔ | ✔ | ✔ | ✔ | ✔ | ✔ | ✔ | ✔ | ✔ | ✔ | ✔ | ✔ | ✔ | |
| APP | ✔ | ✔ | ✔ | ✔ | ✔ | ✔ | ✔ | ✔ | |||||||||
| SAM-7 SAM-9 |
✔ | ✔ | ✔ | ✔ | ✔ | ✔ | ✔ | ✔ | ✔ | ✔ | ✔ | ✔ | ✔ | ✔ | ✔ | ✔ | |
| SAM-23 | ✔ | ✔ | ✔ | ✔ | ✔ | ✔ | ✔ | ✔ | ✔ | ✔ | |||||||
| Lyot | ✔ | ✔ | ✔ | ✔ | ✔ | ||||||||||||
| Lyot-ND | ✔ | ✔ | ✔ | ✔ | ✔ | ||||||||||||
| Grism | ✔ |
* Not currently offered
Brightness limits
To avoid the effects of persistence there is a limit to the brightest star that can be observed with NIX. These limits are described in the User Manual, and the Phase 2 pages. Very bright stars can be observed with the ND filter to attentuate the flux by between 4.5 and 6.0 magnitudes, depending on the wavelength of the observation.
Bad pixels
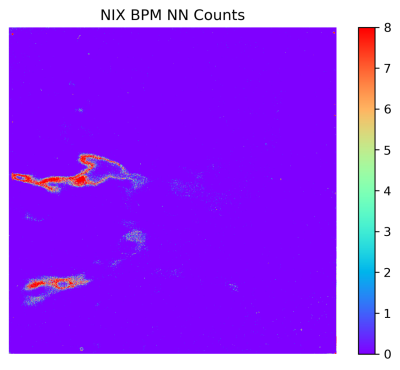
The NIX detector suffers from several regions of highly clustered bad pixels. The figure below shows the number of neigbouring bad pixels that each pixel has. The regions in red should be avoided when planning dither patterns around the detector. A representative bad pixel map is also available to download here that can be used to help plan observations.
Short/Long-wavelength Imaging
Details regarding limiting magnitude and off-axis performance to be added after commissioning is completed.
Apodizing Phase Plate (APP) Coronagraphy
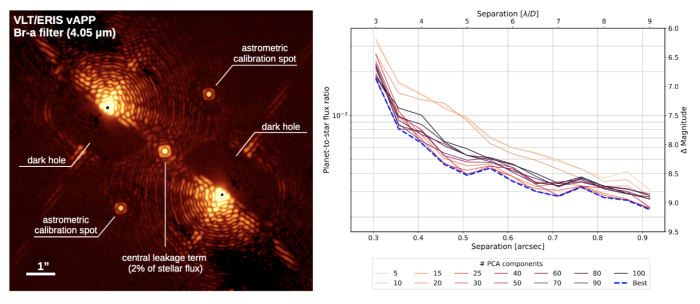
APP can be used for high-contrast imaging science to detect faint companions or structures at small angular separations. The APP mask is used in conjunction with a quater-wave plate and Wollaston prism to generate a deep null in a D-shaped region on opposite sides of two complementary PSFs generated by the Wollaston. Astrometric and photometric calibration can be achieved with the three calibration spots between the two PSFs.
This mode is currently only offered with the narrow band filters within the K and L-bands.
Sparse Aperture Mask (SAM)
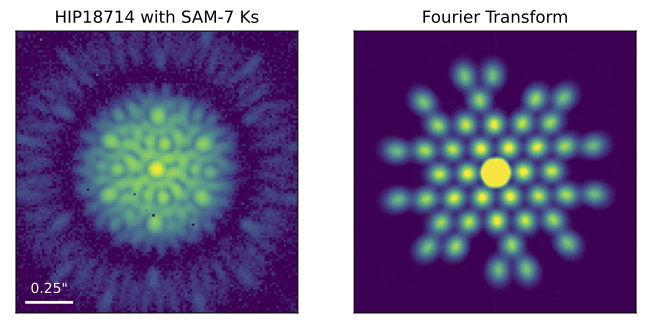
There are three sparse aperture masks that can be used for imaging of companions and circumstellar material to nearby, bright stars. The choice of mask depends on the objectives of the observation and the target brightness. Simple systems (e.g. binaries) and faint targets are better suited for the SAM-7 mask, whereasm SAM-9 and SAM-23 are more suitable for complex and bright systems.
This mode is offered for all filters for SAM-7 and SAM-9, and for narrowband filters for SAM-23. Observations must be made with the 13mas plate scale.
Focal Plane Coronagraph (FPC)
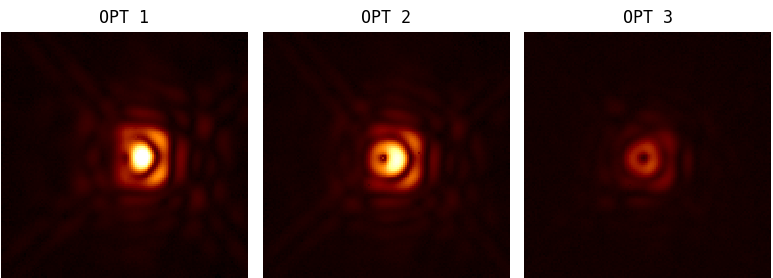
ERIS employs an annular groove phase mask (vortex coronagraph) for focal plane coroanagraphy to provide 360 deress suppression around a point source whilst allowing light from circumstellar disks and companions to be transmited to the final focal plane. This mode can be used in either L or M band (including the two narrow-band Br-a filters). The performance of this mode as characterized during commissioning is described in the User Manual.
Long Slit Spectroscopy (LSS)
NIX can also take data in a long slit spectroscopy mode. This has a single configuration with a wavelength range of 3.05-4.05 microns and a resolution of approximately 900.
