jump to navigation
jump to content
Astro Climatology (Statistics)
Paranal: Meteorological Data Statistics from sensors located at 30 m above ground level during the period Jan 1st 2000 to Dec 31st 2022.
| Percentiles |
0.5% |
5% |
10% |
15% |
20% |
25% |
50% |
75% |
90% |
95% |
97.5% |
99% |
99.5% |
99.9% |
99.95% |
mean |
std |
N |
|---|
| T (Celsius) |
1.6 |
7.4 |
9.0 |
10.0 |
10.7 |
11.3 |
13.2 |
14.8 |
16.0 |
16.8 |
17.5 |
18.4 |
19.0 |
20.4 |
21.0 |
12.8 |
3.00 |
11 512 230 |
|---|
| Tdew (Celsius) |
-34.0 |
-29.4 |
-26.7 |
-24.6 |
-22.9 |
-21.5 |
-15.8 |
-8.7 |
-2.3 |
+1.4 |
+4.1 |
+6.2 |
+7.2 |
+8.3 |
+8.7 |
-15.0 |
9.1 |
11 426 960 |
|---|
| RH (%) |
3 |
4 |
5 |
6 |
7 |
8 |
12 |
21 |
36 |
48 |
59 |
71 |
80 |
96 |
97 |
16.9 |
14.5 |
11 427 076 |
|---|
| WS at 30m (m/s) |
0.4 |
1.5 |
2.3 |
2.9 |
3.4 |
3.9 |
6.2 |
9.2 |
12.8 |
15.0 |
16.9 |
19.1 |
20.6 |
23.4 |
24.4 |
6.9 |
4.1 |
11 475 033 |
|---|
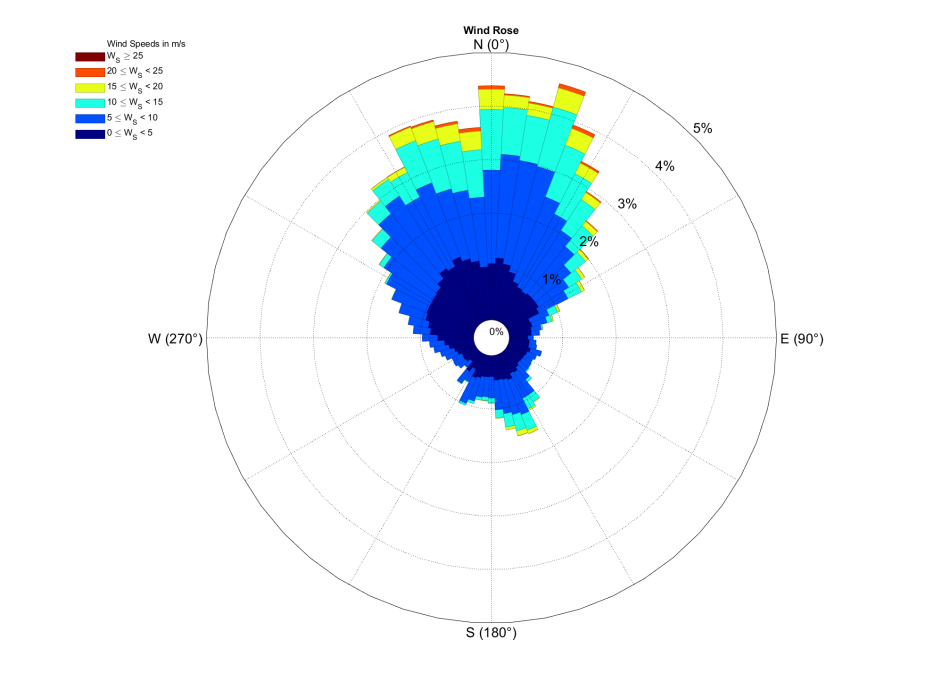
Wind Direction at 30m (degrees)

