SofI Zero Point Trends
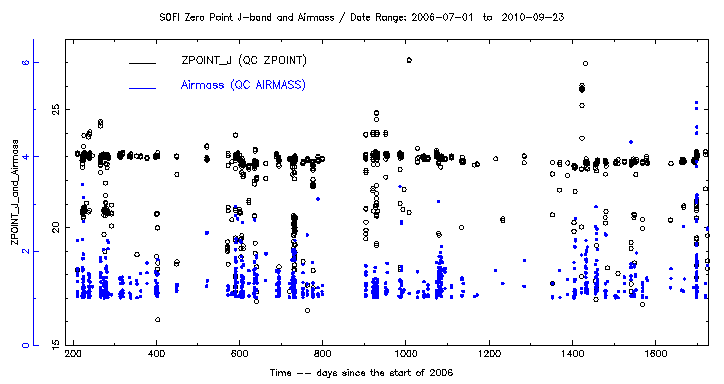
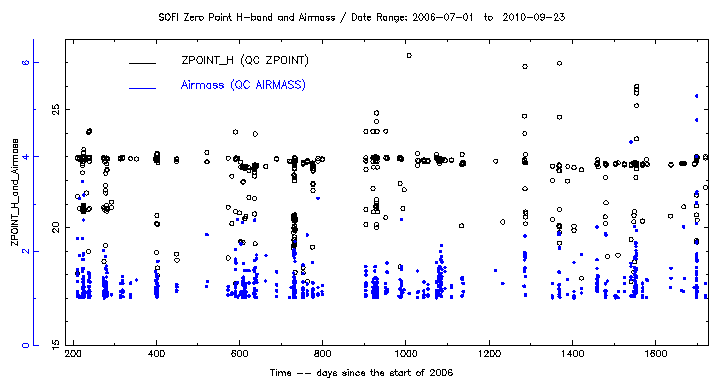
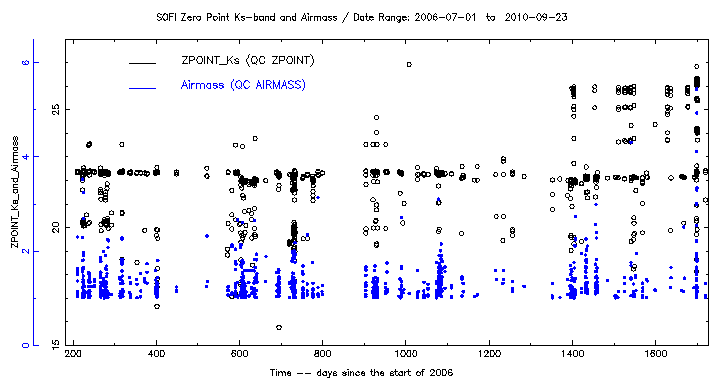
The instrument evolution is being monitored via the pipeline produced PAF files since July 2006. The below plots show photometric zero points in J, H, and Ks. The plots are based on the PAF files from observations of photometric standard stars and have been produced using AutRep. The plots are updated with the latest zero point values at regular intervals.
The zero points are not science grade but meant as a reference to the basic trends. In general, all zero points from all standard star observations irrespective of weather conditions are recorded. Furthermore, outliers are caused by the fact that in some cases neighbouring stars are mistaken by the automatic pipeline for the actual standard stars.
The following three plots show the raw zero points in J, H, and Ks together with the airmass of the observations. Irrespective of outliers the y-range of the plot is adjusted to the most relevant region.


The airmass-corrected zero points in J, H, and Ks are shown below. The airmass corrections are based on standard values.


